Design the whole building.
Coordinate enclosure performance, heating and cooling loads, equipment capacity, distribution, ventilation, and hot water from the beginning.
 Energy DocsHome Performance Contractor, Inc.
REDDING ZNE FIELD STUDY 01 · BONHURST
$0 in annual kWh charges; the City connection fee still applies. Commuting miles represent the driving energy available from annual surplus solar.
An all-electric home that produces significantly more energy than it uses annually—even while keeping every room below 70°F during Redding’s hottest summer days. Enough surplus for about 9,200 miles of EV driving.
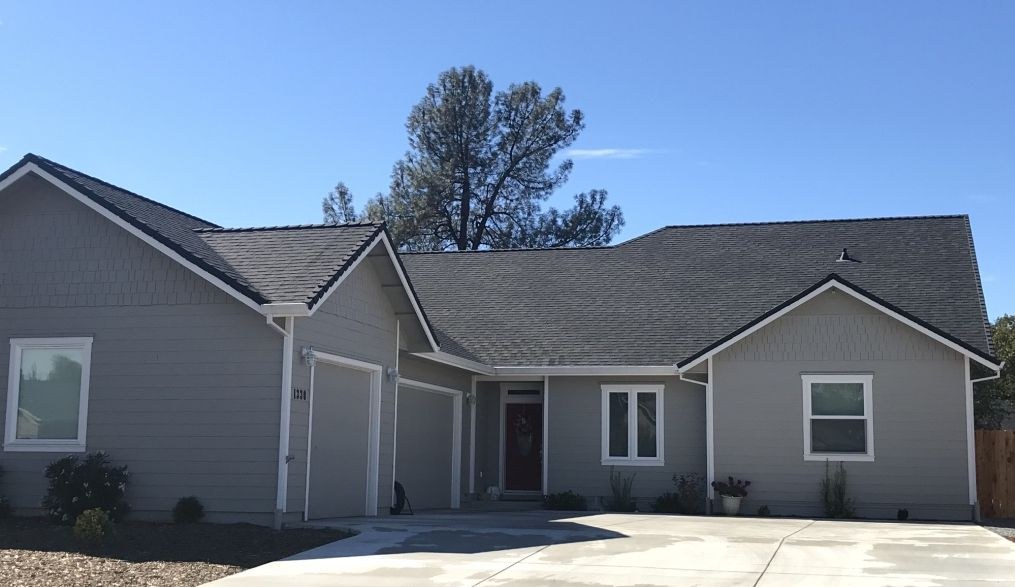
The Bonhurst home was Mike’s first published residential project with Davis Energy Group / Frontier Energy—and the highest-performing residence they had monitored. Natural gas was available at the site; Mike deliberately designed and built the 2,372-square-foot residence entirely around electricity, with no gas connection. Heating, cooling, hot water, cooking, and appliances all belong in the energy balance.
His approach was to reduce the loads first: an exceptionally airtight enclosure, ducts and mechanical equipment inside conditioned space, efficient water heating, and a ¾-ton ducted mini-split. A compact solar array then supplied more energy over the monitored year than the entire home consumed.
EVERY USE INCLUDED · JULY 2017–JUNE 2018
Solar generated 8,052 kWh while the home used 5,291 kWh, leaving 2,761 kWh of surplus energy. That use includes heating, cooling, hot water, cooking, appliances, lighting, plug loads, and even the research monitoring equipment.
There was no natural gas use outside that accounting. The surplus is what remained after every household energy use was counted over the full year.
Read the full 2018 PG&E / Frontier Energy report (opens in a new tab)About 9,200 EV miles per year.
2,761 kWh of measured annual surplus ÷ 0.30 kWh per mile ≈ 9,200 miles.
That is the driving energy the surplus could supply at an illustrative consumption rate of 30 kWh per 100 miles, including charging losses. It is an annual energy equivalent, with actual mileage depending on the vehicle, weather, and driving.
The assumed rate matches an EPA-rated 2023 Nissan Leaf example published by the U.S. Department of Energy. EV mileage is calculated from the surplus; actual charging costs depend on the charging schedule and electricity rates. DOE example and calculation method (opens in a new tab) · EPA testing and charging losses (opens in a new tab)
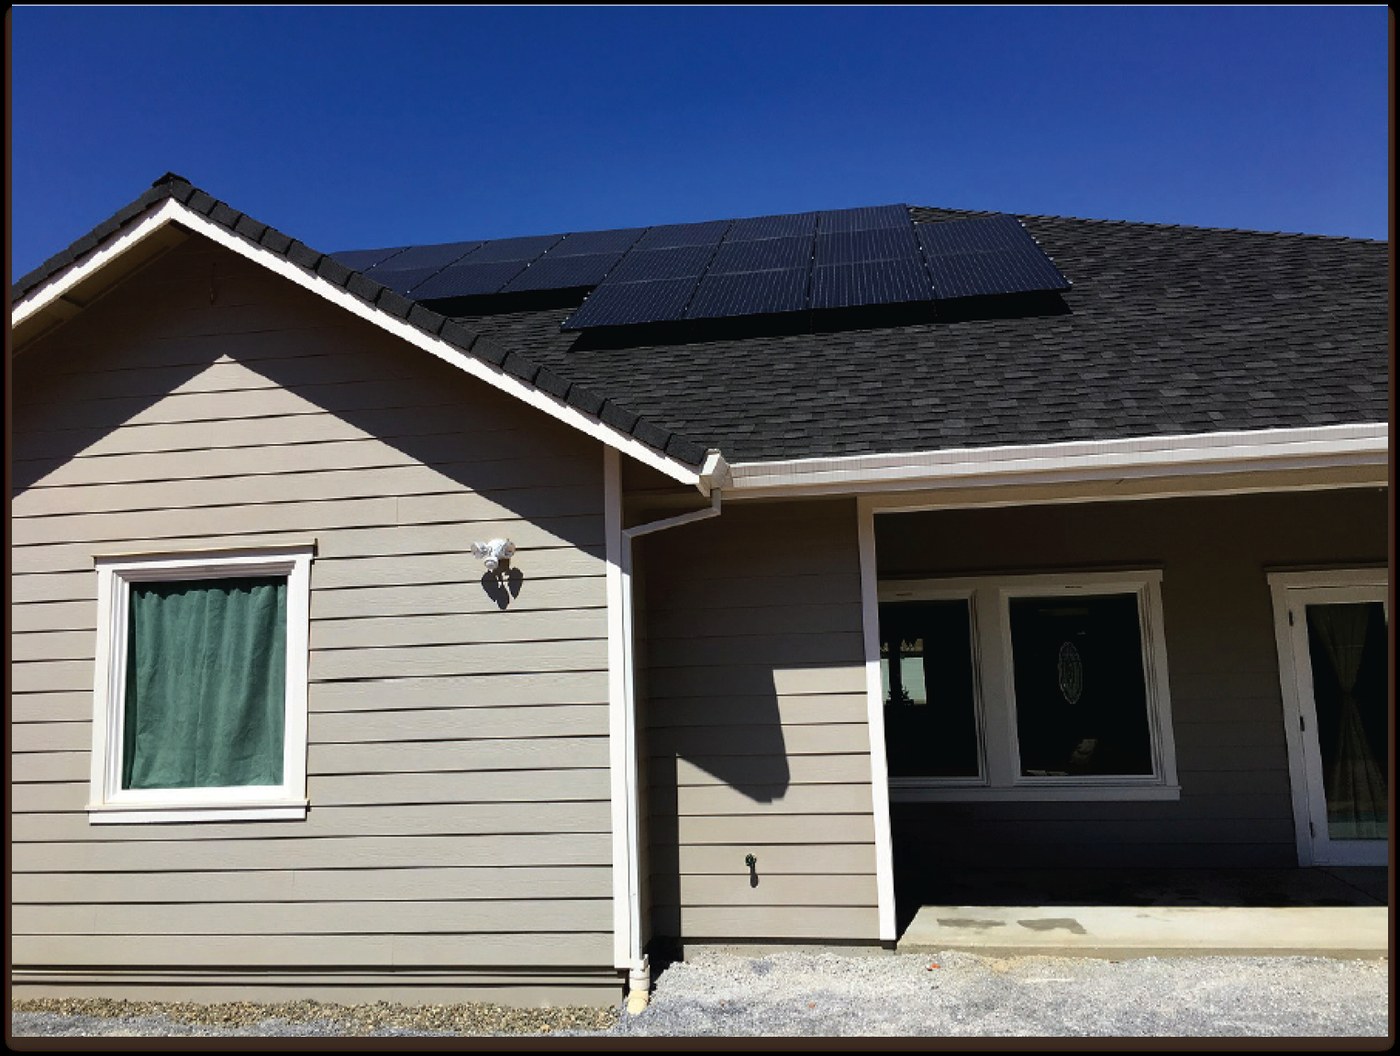
19 PANELS · DESIGNED INTO THE HOME
The 5.32 kW array sits on the west-southwest-facing roof at the back of the home. Its 19 panels leave the front roofline clear and preserve the home’s curb appeal.
The compact array works because the whole house needs so little energy. Enclosure quality, efficient systems, and careful construction make room for both generous comfort and a substantial annual solar surplus.
SUMMER COMFORT · WHOLE-HOME PERFORMANCE
Even during Redding’s hottest summer days, every room stayed below 70°F while the cooling system drew less power than a common hair dryer.
Mike designed Bonhurst for Redding’s 110°F-plus summer heat. A ¾-ton ducted mini-split serves the entire 2,372-square-foot home. High-performance insulation and air sealing keep the cooling load low; carefully designed and installed ductwork and mechanical systems deliver that comfort throughout the home.
Power comparison: the highest one-minute cooling-system draw in the July–September 2017 and May–June 2018 data was 1,444 watts, below a common 1,875-watt hair dryer. This compares electrical power while running. Example hair-dryer rating (opens in a new tab)
Across the full monitored year, cooling used 1,683 kWh and heating used 248 kWh—just 1,931 kWh combined. That space-conditioning energy is fully included in the annual balance, leaving a substantial solar surplus for other uses, such as EV driving.
MIKE’S WORK
Coordinate enclosure performance, heating and cooling loads, equipment capacity, distribution, ventilation, and hot water from the beginning.
Turn the design into a built home with precise air sealing, insulation, compact distribution, and mechanical systems inside the conditioned enclosure.
Use diagnostic testing and a full year of monitoring to establish how the completed home actually operates in its climate.
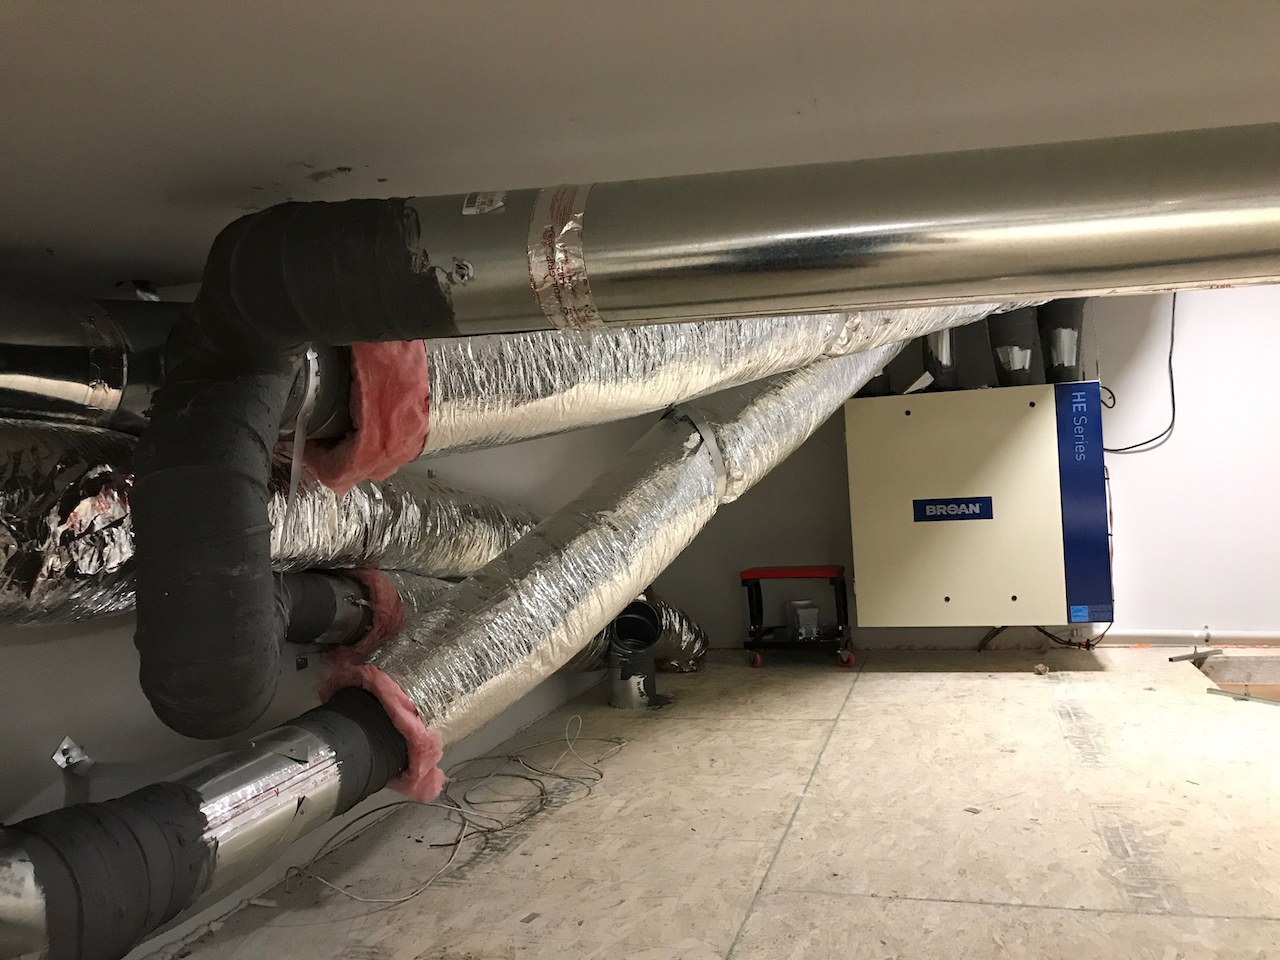
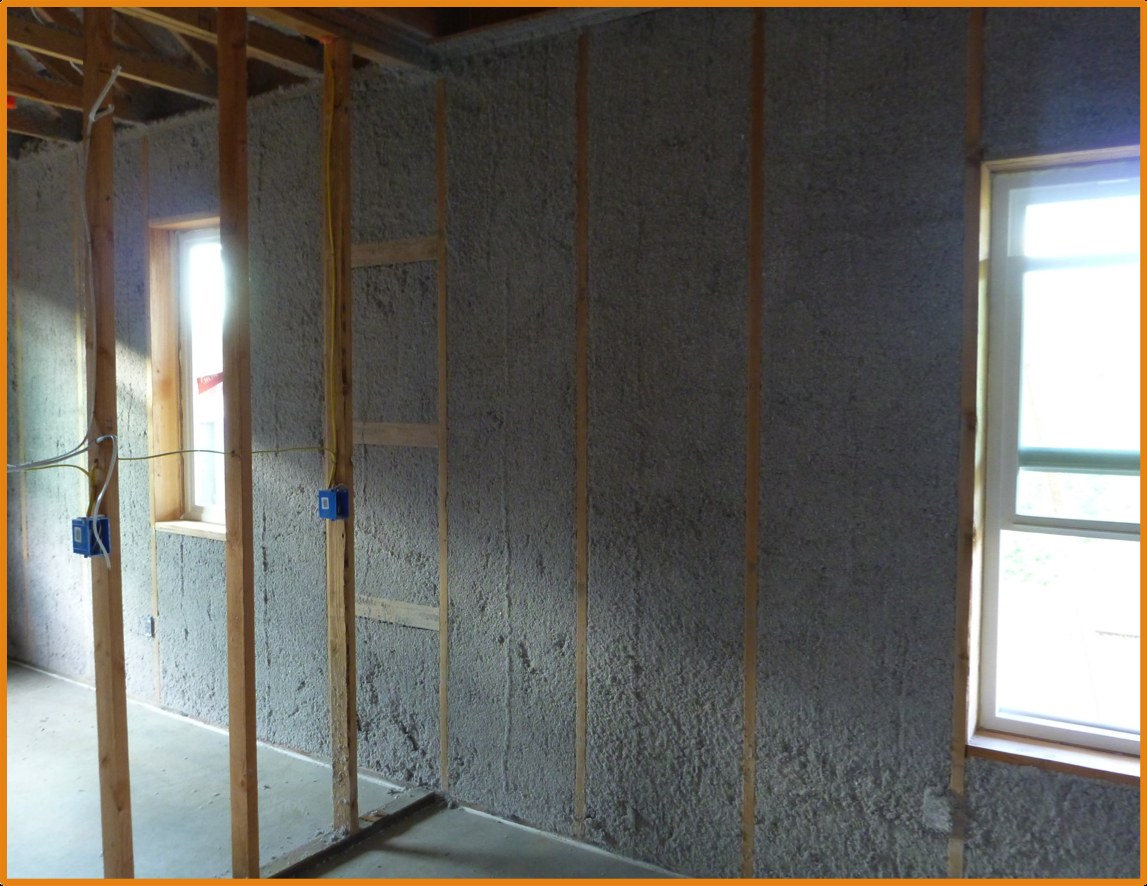
The original monitoring report was issued September 26, 2018. Study results are specific to this home, its occupants, weather, and monitoring period. The home was built in 2016–2017. Room-by-room summer comfort reflects Mike’s field observations; the report’s continuous indoor temperature readings were taken near the thermostat.
Original report and study methods (opens in a new tab)CONTINUE TO REDDING ZNE 02